


Abstract
Ketogenic diets (KDs) that elevate ketones into a range referred to as nutritional ketosis represent a possible nutrition approach to address the emerging physical readiness and obesity challenge in the military. An emerging body of evidence demonstrates broad-spectrum health benefits attributed to being in nutritional ketosis, but no studies have specifically explored the use of a KD in a military population using daily ketone monitoring to personalize the diet prescription.
To evaluate the feasibility, metabolic, and performance responses of an extended duration KD, healthy adults (n = 29) from various military branches participated in a supervised 12-wk exercise training program. Fifteen participants self-selected to an ad libitum KD guided by daily measures of capillary blood ketones and 14 continued their normal mixed diet (MD). A battery of tests were performed before and after the intervention to assess changes in body mass, body composition, visceral fat, liver fat, insulin sensitivity, resting energy metabolism, and physical performance.
All KD subjects were in nutritional ketosis during the intervention as assessed by daily capillary beta-hydroxybutyrate (βHB) (mean βHB 1.2 mM reported 97% of all days) and showed higher rates of fat oxidation indicative of keto-adaptation. Despite no instruction regarding caloric intake, the KD group lost 7.7 kg body mass (range −3.5 to −13.6 kg), 5.1% whole-body percent fat (range −0.5 to −9.6%), 43.7% visceral fat (range 3.0 to −66.3%) (all p < 0.001), and had a 48% improvement in insulin sensitivity; there were no changes in the MD group. Adaptations in aerobic capacity, maximal strength, power, and military-specific obstacle course were similar between groups (p > 0.05).
US military personnel demonstrated high adherence to a KD and showed remarkable weight loss and improvements in body composition, including loss of visceral fat, without compromising physical performance adaptations to exercise training. Implementation of a KD represents a credible strategy to enhance overall health and readiness of military service members who could benefit from weight loss and improved body composition.
INTRODUCTION
The modern soldier is tasked with multiple demands that stress adaptive capabilities and present unique challenges to maintain optimal health and readiness. Despite recognition of the heightened need for peak performance, an estimated two-thirds of active military personnel are overweight or obese,1,2 which mirrors the obesity epidemic in the general population.3 Nearly 3 out of 4 young people aged 17–24 fail to qualify for military service, mainly due to obesity and failure to meet fitness standards,4 thus posing an impending recruitment crisis. Given the rising rates of obesity in society and the military, there is an urgent need to explore credible nutrition counter-measure strategies.
The military follows the United States Department of Agriculture’s dietary guidelines for Americans that advocate low-fat, high-carbohydrate foods. Americans have followed these guidelines for decades marked by a significant increase in the absolute amount of carbohydrate, a dietary pattern temporally-associated with the marked rise in obesity.5 A diet that emphasizes carbohydrate suppresses fat oxidation and production of ketones,6,7 which limits potential metabolic and signaling benefits of these metabolites.8 Over half of active military personnel report using carbohydrate and caffeine-containing energy drinks in the past month.1 For many, excessive carbohydrate, especially in the form of added sugar as in energy drinks, may contribute to obesity and other health problems.
Ketogenic diets (KDs) that emphasize carbohydrate restriction, moderate-protein, fat to satiety, and nutritional ketosis (defined as circulating ketones between 0.5 and 5.0 mM) represent a promising alternative approach to enhance health and readiness. In nutritional ketosis the metabolic needs of organs/tissues are met primarily by ketones and fatty acids. Athletes in nutritional ketosis show extraordinary rates of fat oxidation (>1.5 g/min).7 In non-athletes, many studies have demonstrated that β-hydroxybutyrate (βHB) is a preferred fuel for the brain9 and heart.10 More recently, βHB has been shown to be a potent cellular signaling molecule11 that positively affects gene expression, inflammation, endogenous antioxidant defense, and healthspan.12,13 Of particular relevance to the obesity problem in the military, sustained ketosis is associated with greater loss of body fat without explicit instruction or intent to restrict calories.14 In addition, KDs have also been shown to reverse metabolic syndrome15 and type-2 diabetes.16 The few studies published that examined the effects of a KD versus a mixed diet in the context of endurance17 or resistance18–20 training showed enhanced weight loss with a KD without compromising performance. No studies have specifically explored the use of a KD in a military population and none have used daily ketone monitoring to guide diet prescription. The purpose of this investigation was to evaluate the feasibility, metabolic and performance effects of an extended duration KD in motivated individuals affiliated with the military undergoing an exercise training intervention.
METHODS
Experimental Approach
This was a two-group prospective intervention study in a targeted group of individuals associated with the US military. Subjects self-selected into either a ketogenic (KD) or mixed (MD) diet group. We chose not to randomize participants because military personnel often have a choice in dietary preference when not deployed, and successful implementation of a KD requires considerable personal commitment. Therefore, we employed self-selection to increase compliance and translation of the findings. Both groups participated in an identical supervised training program that emphasized strength and power. Compliance to the KD was measured throughout the intervention by daily assessment of capillary βHB. A battery of tests were performed before and after the intervention.
Participants
Participants were recruited from Ohio State Reserve Officer Training Corps (ROTC) and other local groups with a military affiliation. The primary recruitment goal was to replicate the demographics of the American Armed Forces in respect to age, sex, race, and body mass.21,22 Potential participants were excluded if they had previous experience with a KD, were age ≥50 years, met specific health criteria (endocrine dysfunction, hormonal imbalances, medication, injuries, allergies, cardiovascular disease, non-smokers), or could not exercise safely.23 All procedures were approved by an Institutional Review Board and all subjects provided written informed consent prior to participation.
Thirty-four individuals completed informed consent and completed baseline testing. Participants in the KD (n = 17) and MD (n = 17) groups were initially matched for age, body mass, body composition, and sex. Five participants (3 from MD and 2 from KD) withdrew during the intervention due to moving out of town, gain or loss of a family member, or previously unforeseen academic and work schedule conflicts. A total of 29 participants completed the study (Table I). Their breakdown in respect to military affiliation was Army ROTC (n = 12), Army ROTC Cadre (n = 3), reserve Army Captain (n = 1), Army National Guard (n = 2), Enlisted Airman First Class (n = 1), Air National Guard (n = 3), Marine Veteran (n = 5), Army Veteran (n = 1), and Navy Veteran (n = 1). Due to the attrition, the KD group had a significantly higher body mass than the MD group at baseline. Variation in demographics and anthropometrics resembled that of the typical United States military population.21,22 All participants had experience in body mass exercise, calisthenics, and endurance exercise 3–4 days/week, but the majority were inexperienced with free-weight resistance exercise and Olympic lifts for whole body strength and power.
Participant Descriptors
| MD (n = 14) | KD (n = 15) | p | |
|---|---|---|---|
| Sex | F = 2 | F = 2 | --- |
| M = 12 | M = 13 | ||
| Age (years) | 24.6 ± 9.0 | 27.4 ± 6.8 | 0.345 |
| (18–50) | (20–37) | ||
| Height (cm) | 179.4 ± 5.2 | 175.5 ± 5.7 | 0.061 |
| (167.6–190.5) | (165.1–182.9) | ||
| Weight (kg) | 79.8 ± 5.5 | 85.7 ± 7.8 | 0.022* |
| (70.5–87.3) | (71.8–93.2) | ||
| BMI | 24.9 ± 2.4 | 27.9 ± 2.9 | 0.005* |
| (21.1–27.8) | (24.1–33.8) | ||
| Body fat (%) | 21.2 ± 8.4 | 24.5 ± 4.7 | 0.196 |
| (11.8–40.5) | (14.7–35.1) |
Values are mean ± SD (range), p-values from independent t-test, *Significant (p < 0.05).
Diet Interventions
The KD group received frequent coaching to help participants reach and maintain nutritional ketosis. They were provided unlimited amounts of frozen, pre-cooked meals (Quest Nutrition, El Segundo, CA) and grocery supplies for the duration of the intervention. Carbohydrate and protein intakes were initially limited to 25 and 90 g/d, respectively, until capillary βHB reached 1 mM. Thereafter, participants were encouraged to gradually increase carbohydrate and protein intakes while maintaining daily capillary βHB ≥1 mM. A sodium intake of 4-5 g/d was strongly encouraged to avoid symptoms of hypovolemia due to the natriuresis of ketosis. Carbohydrate intake was targeted at <50 g/day guided and included non-starchy vegetables, nuts, seeds, select fruit and berries. Protein goals were 0.6–1.0 g/kg of lean body mass. Total energy intake was ad libitum. Non-starchy vegetables and fats were encouraged to achieve satiety and add variety and essential nutrients. Excess alcohol consumption defined as ≥2 drinks per day was discouraged for both groups. KD participants were provided with a ketone/glucose monitor (Precision Xtra, Abbot, Illinois) for daily measurements of capillary glucose and βHB. KD participants took measurements every morning before eating and immediately sent pictures of the readings to the research team.
The MD group participants maintained their habitual diet with a minimum consumption of ~40% carbohydrate. Participants from both groups were provided the opportunity to meet with registered dietitians to discuss diet strategies. All participants were instructed to eat to satiety with no specific prescription regarding caloric intake. Dietary supplements were not allowed.
Physical Training Intervention
Both groups participated in a supervised 12-wk progressive resistance training program 2 days/wk (~60 min/session) designed to standardize physical activity between groups while increasing whole body strength and power movements important for military relevant tasks. Subjects completed one additional training session each week aimed at maintenance of cardiopulmonary fitness (e.g., running and body-weight circuit training) for a minimum of 30-min. Training modulated from 3 sets of 12 reps at 60%-1 repetition maximum (RM) to 4 sets of 4 reps at 95%-1RM during overreach. Each resistance training session concluded with ~15 min of whole-body, high-intensity circuit training. Total volume (sets x reps x #of exercise occurrences) and total weight (volume × weight lifted) for the primary compound lifts was calculated.
Blood Collection and Analysis
Fasting blood samples were taken via venipuncture, allowed to clot and then centrifuged at 1,200 g for 10 min at 4°C. Serum was aliquoted into tubes and stored in ultra-low freezers for batch analysis of glucose and insulin. Frozen samples were thawed immediately prior to analysis. Serum insulin was analyzed in duplicate by ELISA (IN374S, Calbiotech, El Cajon, CA, USA). Serum glucose was measured with an enzymatic assay (Hexokinase Reagent Set G7517, Pointe Scientific, Canton, MI, USA). Glucose and insulin had intra-assay coefficients of variation of 4.05%, and 4.10% respectively. Glucose and insulin were used to calculate insulin resistance.24
Body Composition & Body Fat
Body mass (Seca, Chino, CA, USA) and whole-body composition were measured using dual-energy X-ray absorptiometry (DXA)(iDXA, GE Healthcare, Chicago, IL, USA). Visceral adipose tissue (VAT) mass and liver organ fat fraction were assessed by magnetic resonance imaging (MRI) using a 1.5 Tesla system (MAGNETOM, Avanto, Siemens Healthcare, Germany). The abdomen, including the entire liver, was scanned in a single breath-hold with a slice thickness of 5 mm. Fat Percentage (FP) and Water Percentage (WP) image maps were generated automatically using the variable projection (VARPRO) fat separation technique.25 The resulting digital imaging and communications in medicine (DICOM) images were processed using semi-automated, custom-built software to segment VAT and subcutaneous adipose tissue compartments and calculate the volume and mass of fat within the abdominal VAT depot.
Hepatic fat percentage was quantified using the same VARPRO image data used for VAT measurements. This technique provides an accurate and objective measurement of tissue fat composition on a pixel by pixel basis. Using the Fat Percentage maps automatically generated by the VARPRO technique fat fraction was measured in regions of interest (ROIs) manually placed in each of the nine standard anatomical liver segments.26 The ROIs were drawn to avoid veins and visible image artifacts. Three measurements were taken within each segment (in three different slice planes) for a total of 27 measurements. The hepatic fat fraction (%) was expressed as the average fat fraction across all nine liver segments.
Resting Metabolic Rate
Indirect calorimetry (TrueOne 2,400, ParvoMedics, Sandy, UT, USA) was used to evaluate resting metabolic rate (RMR) and respiratory exchange ratio (RER). Participants fasted for a minimum of 8-hours and avoided strenuous activity for a minimum of 24-hours prior to testing. Prior to RMR testing and after verification of euhydration via urine specific gravity (USG), participants rested quietly in a supine position for 30-min. A plastic canopy was placed over thier head and neck. After stabilization, ~20-min of steady-state data collection was obtained.27
Physical Performance
Familiarization with movements associated with testing and training were included in order to help facilitate true physiologic testing of participants rather than learning effects. Participants were asked to refrain from physical exercise, drugs, and alcohol 24-hours prior to testing, and arrive adequately hydrated. Mid-intervention physical performance testing was conducted during week 1 (W1) and at midpoint (MP). W1 was completed between days 4 and 7 of the nutritional intervention. The same testing protocol was repeated for each testing timepoint throughout the intervention.
A countermovement vertical jump was evaluated to determine lower body power and performance capabilities.28 Participants performed a practice jump, followed by 3 maximal effort jumps with 30-sec rest between repetitions. Jump power (W) was measured using a force plate with Accupower 2.0 software (Advanced Mechanical Technology Inc., Watertown, MA, USA) and recorded at 200 Hz. The best jump was used for analysis.
Maximal strength was determined for the back squat and bench press using a barbell (EliteFTS, London, OH, USA) and free weights using a protocol documented in detail and used many times in our laboratory.29
Participants completed ten sprint intervals in two sets of five on a self-propelled, resistance treadmill (Hi-Trainer, Bromont, Canada). Both sets consisted of 5 sprints, each lasting 10 sec followed by 10 sec of walking rest. The two sets were separated by 2 min of recovery. Participants were encouraged to exert maximal effort for each sprint and discouraged from pacing. They were familiarized with the machine and allowed to adjust the height and angle of torso support. These preferences were recorded and repeated for all subsequent testing.
Participants completed a brief obstacle course30 that included a 30 m sprint, zig zag run, and 70 kg casualty drag. Participants started in the prone position, sprinted 30 m to a cone, then zig-zagged through 9 cones, and completed the course by dragging a 70 kg dummy across the finish line. The average of the two times was used for analysis.
Statistical Analyses
Using change in body composition over the 12 wk intervention as the primary outcome, we estimated at least 10 subjects per group were required to detect a difference of greater than 2% body fat between groups with a 95% confidence level and 80% power. Independent T-tests were used to compare differences between groups at baseline. A two-way repeated analysis of variance (ANOVA) with diet as a between factor and time as a within factor was used to assess changes in outcome variables over time between groups. Temporal changes in daily measures of blood glucose and ketone were analyzed using repeated-measures ANOVA after averaging weekly values. Adjusted pairwise comparisons were made using a Bonferroni correction. Significance was set a priori at p ≤ 0.05.
RESULTS
Compliance
Subjects in the KD group recorded glucose and ketone values 97% of days during the intervention. Blood glucose remained relatively stable over the intervention with a mean 87 ± 6 mg/dL (range 72–95 mg/dL). Week 2 capillary glucose concentration was lower (p = 0.019) than week 6 (Fig. 1). Mean capillary blood βHB was 1.2 ± 0.4 mM (range 0.9 to 1.8 mM) in KD participants (Fig. 1), indicating each subject was in nutritional ketosis. On average participants reached nutritional ketosis (βHB ≥0.5 mM) in 2.9 ± 2.0 days and reported two consecutive days of nutritional ketosis 3.5 ± 2.0 days after beginning the KD. Mean βHB was highest during week 2 (2.0 ± 0.5 mM) and was lower during subsequent weeks of intervention, which reached significance at week 7 (1.0 ± 0.4 mM; p = 0.041) and week 9 (1.2 ± 0.5 mM; p = 0.029). The KD group attended 84% of physical training sessions while the MD group completed 88%. There were no significant differences between groups in training volume or total weight lifted (Table II).
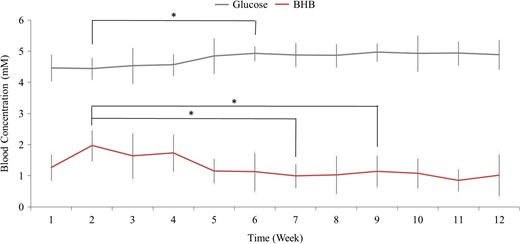
Mean daily blood glucose and whole blood capillary βHB concentrations in participants assigned to the ketogenic diet (N = 15). Each data point represents the week average. *Indicates significant (p < 0.05) difference from corresponding week 2 value.
Physical Training Compliance and Attendance
| MD (n = 14) | KD (n = 15) | p | |
|---|---|---|---|
| Attendance | |||
| Sessions | 15.4 ± 3.4 | 15.0 ± 3.1 | 0.727 |
| Percent (%) | 87.7 ± 10.1 | 84.0 ± 12.4 | 0.378 |
| Total volume (reps) | 833.9 ± 166.4 | 863.1 ± 142.1 | 0.615 |
| Squat | 233.1 ± 23.8 | 236.2 ± 36.2 | 0.770 |
| Bench press | 233.4 ± 35.4 | 236.2 ± 34.1 | 0.832 |
| Deadlift | 147.5 ± 34.6 | 157.3 ± 41.8 | 0.498 |
| Overhead press | 95.6 ± 46.2 | 115.7 ± 37.0 | 0.205 |
| Row | 86.0 ± 51.0 | 74.7 ± 24.5 | 0.447 |
| Clean | 38.2 ± 18.6 | 43.2 ± 16.6 | 0.460 |
| Total weight lifted (kg) | 50,523.1 ± 13,835.4 | 55,802.9 ± 15,209.3 | 0.338 |
| Squat | 17,673.1 ± 4740.0 | 20,084.9 ± 5,460.4 | 0.216 |
| Bench press | 14,054.5 ± 4774.3 | 15,157.4 ± 5227.7 | 0.559 |
| Deadlift | 9,911.5 ± 2591.8 | 11,760.1 ± 3,886.0 | 0.146 |
| Overhead press | 3,130.6 ± 1532.2 | 3,944.9 ± 1,418.3 | 0.149 |
| Row | 3,755.5 ± 2747.6 | 2,794.2 ± 1,180.9 | 0.226 |
| Clean | 1,997.4 ± 972.8 | 2,208.6 ± 1,181.9 | 0.610 |
p-values from independent t-test.
Body Composition
Body mass decreased in KD vs MD (−7.7 kg vs 0.1 kg; p < 0.001) from baseline to post intervention. All 15 subjects in the KD group lost greater mass than any participant in the MD group. Body fat percentage decreased in KD vs MD (−5.1 vs −0.7%; p < 0.001). Lean body mass (LBM) decreased in KD while MD participants gained (−1.4 vs 0.8 kg; p < 0.001). Whole-body fat mass decreased in KD to a greater extent than MD (−5.9 vs −0.6 kg; p < 0.001). Mean visceral fat volume decreased significantly more in KD than MD (−561.3 vs −1.9 cc; p < 0.001), equating to a decline in VAT mass (−0.5 vs 0.0 kg; p < 0.001) based upon fat density 0.9196 kg/L.31 Mean liver fat percentage was normal at baseline in KD (2.4% ± 1.9%) and MD (1.4% ± 0.3%) participants and did not change significantly in either group, but there were two subjects who showed a rather large change, one a 4.5% increase and one a 3.5% decrease (Fig. 2).
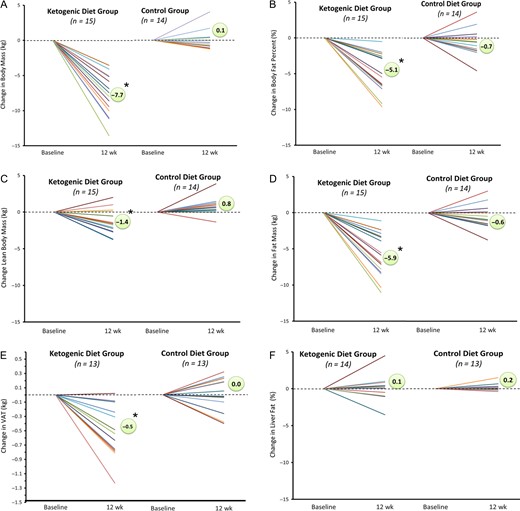
Individual responses in body mass and body composition. Anthropometric changes measured at baseline and post-intervention for KD and MD participants via DXA and MRI.
Metabolic and Hormonal Responses at Rest
There were no changes in absolute or relative RMR, but RER decreased in the KD group indicating increased reliance on fat from 59 to 84% of energy expenditure (Table III). Glucose (p = 0.304), insulin (p = 0.993), and insulin sensitivity (p = 0.182) were similar between MD and KD at baseline. Glucose remained unchanged post-intervention in the KD (79.1 ± 10.7 to 74.8 ± 6.1 mg/dL) and MD (75.8 ± 5.9 to 74.8 ± 8.7 mg/dL) groups. Insulin was lower post-intervention (p = 0.005), and the decrease was of greater magnitude in the KD vs MD group (10.3 ± 4.9 to 5.7 ± 2.4 vs 8.1 ± 4.6 to 7.3 ± 2.8 μIU/mL; p = 0.035). Insulin sensitivity increased in the KD group (2.1 ± 1.2 to 1.1 ± 0.5) and remained unchanged in the MD group (1.5 ± 0.9 to 1.4 ± 0.5) (p = 0.042).
Resting Metabolic Rate
| MD (n = 14) | KD (n = 15) | ANOVA | ||||
|---|---|---|---|---|---|---|
| Pre | Post | Pre | Post | P(time) | P(time*diet) | |
| RMR (kcal) | 1792.3 ± 138.6 | 1730.7 ± 96.2 | 1849.2 ± 183.8 | 1792.6 ± 272.7 | 0.234 | 0.914 |
| Relative RMR (kcal/kg) | 22.5 ± 2.5 | 21.7 ± 2.0 | 21.6 ± 2.3 | 22.8 ± 2.4 | 0.744 | 0.100 |
| Respiratory Exchange Ratio (RER) | 0.82 ± 0.04 | 0.83 ± 0.05 | 0.82 ± 0.08 | 0.75 ± 0.02 | 0.024* | 0.003# |
| % Carbohydrate | 40.4 ± 14.0 | 44.0 ± 15.6 | 41.3 ± 26.1 | 16.2 ± 8.7 | 0.022* | 0.003# |
| % Fat | 60.0 ± 13.9 | 56.5 ± 15.5 | 59.1 ± 25.9 | 83.9 ± 8.6 | 0.022* | 0.003# |
*Significant (p < 0.05) time effect, #Significant (p < 0.05) interaction effect.
Strength and Power Performance
There were no differences at baseline or in response to the intervention between groups in a majority of strength and power measures of anaerobic performance (Table IV). Other than a 22% increase in relative 1RM barbell back squat (p = 0.009), anaerobic parameters related to strength and power performance were similar between groups.
Anaerobic Performance Measures
| MD (n = 14) | KD (n = 15) | ANOVA | ||||||||||
|---|---|---|---|---|---|---|---|---|---|---|---|---|
| 1-RM strength | Pre | W1 | MP | Post | Mean ∆ | Pre | W1 | MP | Post | Mean ∆ | p(time) | p(time*diet) |
| Squat (kg) | 103.1 ± 24.9 | 106.4 ± 23.1 | 119.2 ± 21.7 | 122.4 ± 24.1 | 19.3 | 117.6 ± 32.5 | 117.3 ± 28.8 | 126.5 ± 26.9 | 129.4 ± 24.3 | 11.8 | 0.069 | 0.944 |
| Squat relative (kg/BW) | 1.31 ± 0.35 | 1.35 ± 0.35 | 1.51 ± 0.32 | 1.54 ± 0.35 | 0.24 | 1.37 ± 0.34 | 1.41 ± 0.29 | 1.58 ± 0.30 | 1.63 ± 0.26 | 0.3 | 0.009* | 0.996 |
| Bench press | 84.6 ± 29.4 | 85.2 ± 29.2 | 89.4 ± 28.7 | 90.9 ± 29.1 | 6.3 | 95.9 ± 33.1 | 95.6 ± 31.2 | 95.1 ± 28.2 | 95.9 ± 29.0 | 0.0 | 0.974 | 0.969 |
| Bench press relative (kg/BW) | 1.07 ± 0.39 | 1.08 ± 0.39 | 1.14 ± 0.39 | 1.15 ± 0.39 | 0.1 | 1.12 ± 0.35 | 1.14 ± 0.33 | 1.18 ± 0.33 | 1.21 ± 0.32 | 0.1 | 0.803 | 1.000 |
| Counter movement jump | Pre | W1 | MP | Post | Mean ∆ | Pre | W1 | MP | Post | Mean ∆ | p(time) | p(time*diet) |
| Height (cm) | 34.3 ± 9.8 | 32.8 ± 8.7 | 33.5 ± 8.0 | 35.6 ± 11.0 | 1.4 | 34.0 ± 8.3 | 33.4 ± 8.3 | 33.5 ± 8.0 | 34.7 ± 7.1 | 0.8 | 0.803 | 0.988 |
| Rel. force (N/kg) | 21.3 ± 2.4 | 21.3 ± 2.4 | 21.6 ± 2.2 | 20.1 ± 6.3 | −1.3 | 22.1 ± 3.3 | 21.5 ± 2.3 | 21.8 ± 2.5 | 22.5 ± 2.8 | 0.4 | 0.856 | 0.953 |
| Rel. power output (W/kg) | 48.7 ± 10.5 | 47.9 ± 9.6 | 48.9 ± 9.0 | 47.2 ± 17.5 | −1.53 | 48.1 ± 8.7 | 48.1 ± 8.2 | 48.8 ± 8.0 | 50.2 ± 7.9 | 2.10 | 0.754 | 0.998 |
| Rel. work (J/kg) | 8.0 ± 1.5 | 7.7 ± 1.2 | 7.6 ± 1.1 | 7.4 ± 2.7 | −0.6 | 8.2 ± 1.5 | 7.9 ± 1.0 | 7.9 ± 1.1 | 7.8 ± 1.1 | −0.34 | 0.763 | 0.916 |
| Rel. rate power development (W/s/kg) | 161.2 ± 62.7 | 159.5 ± 55.6 | 173.3 ± 58.9 | 165.0 ± 62.7 | 3.8 | 150.5 ± 61.0 | 151.0 ± 50.4 | 163.3 ± 54.9 | 177.1 ± 60.0 | 26.7 | 0.599 | 0.907 |
| 10 s Sprint intervals | Pre | W1 | MP | Post | Mean ∆ | Pre | W1 | MP | Post | Mean ∆ | p(time) | p(time*diet) |
| Peak power (W) | 822.5 ± 180.2 | 935.7 ± 225.9 | 897.1 ± 167.1 | 932.9 ± 275.1 | 110.4 | 1,046.3 ± 228.2 | 1,025.7 ± 257.0 | 1,030.5 ± 276.9 | 1,031.0 ± 362.7 | −15.3 | 0.433 | 0.841 |
| Relative peak power (W/kg) | 10.4 ± 2.5 | 11.8 ± 2.9 | 11.3 ± 2.0 | 11.7 ± 3.6 | 1.4 | 12.3 ± 2.4 | 12.2 ± 2.5 | 12.7 ± 3.1 | 13.0 ± 4.4 | 0.1 | 0.640 | 0.828 |
| Mean power (W) | 465.8 ± 100.6 | 507.4 ± 90.8 | 540.7 ± 119.6 | 507.9 ± 120.8 | 42.1 | 580.1 ± 99.5 | 583.3 ± 127.8 | 574.3 ± 134.3 | 549.6 ± 104.4 | −30.5 | 0.654 | 0.529 |
| Relative mean power (W/kg) | 5.9 ± 1.4 | 6.4 ± 1.3 | 6.8 ± 1.5 | 6.4 ± 1.6 | 0.5 | 6.8 ± 0.9 | 7.0 ± 1.2 | 7.1 ± 1.4 | 6.9 ± 1.1 | 0.7 | 0.887 | 0.746 |
| Obstacle course | Pre | Post | Mean ∆ | Pre | Post | Mean ∆ | p(time) | p(time*diet) | ||||
| Duration (s) | 38.9 ± 4.7 | 39.0 ± 7.9 | 0.03 | 39.0 ± 6.7 | 36.7 ± 5.7 | −2.3 | 0.572 | 0.560 | ||||
Mean ∆ = mean change pre to post timepoints. *Significant (p < 0.05) time effect; #Significant (p < 0.05) interaction effect.
DISCUSSION
To our knowledge, this was the first study to demonstrate feasibility of an extended KD in a representative sample of United States military personnel (primarily from a ROTC setting) participating in a basic conditioning program. All participants in the KD group demonstrated consistent nutritional ketosis (βHB >1 mM), which was facilitated and personalized by providing them access to palatable ketogenic foods and daily monitoring of ketones. In contrast to shorter studies that failed to permit adequate time for keto-adaptation in active individuals,32 the 12-wk duration provided more time for participants to accumulate benefit from consistently higher rates of fatty acid oxidation and nutritional ketosis. The most noteworthy response was a spontaneous reduction in energy intake resulting in a uniformly greater weight loss for all KD participants. Enhanced weight loss ranging from 1.4 to 5.9 kg in healthy trained humans has been shown before in similar duration KD studies,17,19,33,34 but this is one of the more striking examples as mean weight loss was 7.7 kg. Moreover, from a clinical perspective it is noteworthy that we show for the first time that a KD results in a significant decrease in visceral fat as measured by MRI, which is associated with insulin resistance and elevated risk for cardio-metabolic disease.35 Insulin sensitivity also increased in the KD group, consistent with the previous reports showing substantial improvement in this parameter in obese individuals36 and those with diabetes,16,37 although this finding is a first in a military population. In addition, despite losing an average 9% of initial body mass, keto-adapted subjects showed no impairment in their physical capabilities.
Daily monitoring was a unique feature of the intervention, which allowed us to personalize the KD, monitor compliance, and provide real-time feedback to participants for motivation. The fact that all subjects achieved nutritional ketosis indicates high compliance and ability to maintain this metabolic state for at least 12 weeks. The higher ketones at week 2 compared to subsequent weeks was not expected and to our knowledge not reported before. The gradual decline in circulating βHB after the initial couple weeks of keto-adaptation may be due to subjects consuming slightly more carbohydrate and/or protein. Alternatively, this response may reflect a decreased ketogenesis or increased disappearance of ketones via oxidation or excretion. Future work should explore temporal changes in ketones and underlying mechanisms.
Despite no restrictions on caloric intake, and subjects being given the freedom to consume food in addition to provided meals, every subject in the KD group lost weight (range −3.5 kg to −13.6 kg); whereas body mass remained relatively stable in the MD group. Mean weight loss was above the 5% level considered to be clinically meaningful.38 The magnitude and consistency of weight loss is also of high military relevance considering that many members of the armed forces struggle to meet standards for body weight when pursuing enlistment, continuation of service, physical readiness, or promotion.39,40 Furthermore, weight loss may decrease the prevalence of non-combat injuries in soldiers. A staggering 85% of individuals deployed to Iraq and Afghanistan reported at least one non-combat musculoskeletal injury.41 Non-combat injuries have a greater impact on health and readiness than medical complaints during peacetime and combat.42 Musculoskeletal injuries are the leading cause of hospitalization,43 accounting for a significant amount of lost duty time,44 and cost nearly one billion dollars in care annually.42 A recent study that tracked several hundred thousand soldiers from 2001 to 2011 reported that obese soldiers had a 33% higher risk for musculoskeletal injury.45 Thus, the weight loss effects of a KD alone represent a credible approach to improve the health of aspiring and current soldiers while reducing risk of injury and related healthcare expenses.46
Greater weight loss in subjects consuming an ad libitum KD versus a MD while training has been shown before,17,18 but the magnitude of weight loss was greater in the present study. Subjects in this study were on average overweight but not obese, which makes the magnitude of weight loss even more noteworthy. We hypothesize that enhanced endogenous fuel availability from mobilization of fatty acids from adipose tissue and hepatic production of ketones are key factors leading to reduced perception of hunger and cravings that manifest in decreased caloric intake. Many studies indicate that nutritional ketosis in people carrying excess body fat results in an accelerated rate at which the body oxidizes fat, which is not compensated for by a corresponding increase in dietary fat.47,48 The net result is a loss of body fat with less perceived effort. Indeed, the majority of weight loss in the KD group was derived from fat (~80%).
A novel finding was that subjects on KD experienced a 44% decrease in VAT; a fat depot highly associated with insulin resistance49 and cardio-metabolic risk.35 Previous studies using DXA and other less precise methods have shown that a KD results in loss of fat in the mid-section,19,48,50 but this is the first study to measure VAT using MRI, which provides much greater precision and is considered the gold standard in segmental body fat quantification.51
Previous literature has suggested that a high-fat diet may lead to increased liver fat deposition52; however, in our cohort the high-fat KD did not lead to an overall increase in liver fat. Two KD subjects experienced notable changes in liver fat; one exhibiting an elevation above normal, and another with a high baseline liver fat fraction demonstrating a large decrease. More work is needed to better understand these variable responses associated with the KD. As expected with large weight loss there was a small but significant loss of lean tissue in the KD group. Some decrease in non-fat tissue is expected with significant weight loss due to the need for less musculature in a reduced-weight state, and glycogen- and/or natriuretic/diuretic-associated water loss that occurs in ketosis. A decrease in adipose tissue, which contains connective tissues, would also account for some loss of lean tissue.
Measures of physical performance including maximum strength, power, and repeated sprints were similar between groups suggesting that a 12-wk KD does not have a major impact on the response to training despite substantial loss of body mass. The preservation of strength, power and endurance in a reduced weight state may be relevant for military personnel in certain operational settings. Future studies should explore how a KD affects other military-specific tasks. It is noteworthy that there was no evidence of an adverse effect of the KD on an obstacle course/casualty drag test simulating performance demands in the field.
We studied a relatively small number of subjects. Although the results were positive for many variables it remains to be seen whether such outcomes translate to a larger more diverse group of military personnel. We did not randomize subjects to a diet group and therefore we cannot rule out selection bias. We anticipate military personnel will have an option of which diet to follow in most settings, thereby making the findings more translatable. The KD group was slightly heavier than the MD group, which may have partially contributed to the greater weight loss in that group. This trial was not powered to investigate sex differences related to the diet and training intervention, which should be explored in future studies. The two women in the KD group responded in a similar pattern to the men.
CONCLUSIONS
This is the first study to successfully keto-adapt individuals representing a group affiliated with the US military consisting mostly of Army ROTC. Our results demonstrate high adherence to a KD who made an informed choice to adopt such a diet during 12-weeks of concurrent physical training. High adherence was achieved through a combination of proper education on a KD, access to ketogenic-appropriate meals, and daily feedback regarding level of ketosis. The most striking result was consistent loss of body mass, fat mass, visceral fat, and enhanced insulin sensitivity in virtually all KD subjects despite no specific limitations in caloric intake. Physical performance was maintained across a broad range of tests despite the significant loss of mass (9% of body mass). These results are highly relevant considering the obesity problem affecting all branches of the military. Implementation of a KD guided by blood ketone measures represents a credible strategy for military service members who could benefit from weight loss and improved body composition.
FUNDING
Funding for this work was provided through a gift to the University Foundation to support Low-Carbohydrate Nutrition work.
DISCLOSURES
Dr Volek receives royalties for low-carbohydrate nutrition books. He is founder, consultant, and stockholder of Virta Health Corp; a member of the advisory boards for Atkins Nutritionals Inc, UCAN Co, Ketone Sciences, and Axcess Global; and has received honoraria from Metagenics and Pruvit.

